ENVIRONMENTAL
Energy Efficiency Targets*
In Vision 2030, energy efficiency is our primary means to reduce our carbon emissions and make progress toward carbon neutrality. We have bifurcated our approach to address both landlord and tenant consumption, so we can holistically arrive at our goal of 50% reduction by 2030, below a 2009 base year. As was true in 2020, in 2021, the pandemic and resulting slowdown of activity in our buildings resulted in greater than usual reduction of energy. We expect our consumption to increase over 2021 levels in 2022 before returning to a trajectory of reduction.
TOTAL ENERGY REDUCTION GOAL:
2021 PROGRESS:
50%
BY 2030 WITH SAME-STORE PORTFOLIO (IN-SERVICE OFFICE)
33%
MEASURED IN
kbtu/SF

LANDLORD ENERGY REDUCTION PLAN
What’s Working
Technical Assessments: Our New York City, Chicago, and San Francisco properties over 50,000 SF have undergone ASHRAE Level II Energy Audits and Retro-commissioning, both of which identify existing deficiencies that, when addressed, reduce energy consumption, as well as Energy Conservation Measures (ECMs) that further optimize each asset’s energy performance.
Energy Efficiency Capital Work: Our ECMs serve as the basis of our capital projects, which reduce operating costs, energy consumption, and carbon emissions. We remain committed to completing new capital work every year.
Other Capital Work: While energy efficiency is not the primary value driver for all capital projects, most capital work can save energy when managed responsibly. Such examples include elevator modifications and glazing and envelope improvements, which we procure responsibly and with energy efficiency as a deliverable.
Future Opportunities
Onsite Generation, Renewable Energy, and Energy Storage: We continue to explore opportunities to employ onsite distributed energy resources.
Smart Building Technology: We use predictive analytics and machine learning to run our buildings’ electrical and mechanical systems more efficiently. We upgrade and replace our building management systems to increase the automation of this process.
Regulation & Compliance: Our buildings are located in jurisdictions that have adopted bold climate legislation, which may regulate the carbon emissions from buildings and their related energy consumption. This regulation will have an impact on building codes, building infrastructure, and space planning.

TENANT ENERGY REDUCTION PLAN
What’s Working
Publicly Sponsored Commitments: We have facilitated the commitment of more than 2 million SF of tenants to the Carbon Challenge in New York. We promote tenant participation in energy reduction events such as the WWF Earth Hour and the Building Energy Exchange’s Earth Hour.
Lease-Driven Provisions: As standard practice, we have green provisions in our leases, such as submetered electricity (94% of all leases), submetered water (13%), and capital recovery clauses for energy efficiency projects (63%).
Meaningful Stakeholder Engagement: In 2021, with reduced occupancy continuing throughout most of the year in our buildings, we targeted tenant engagement opportunities with those that were making active changes to their spaces, often in preparation for their offices reopening.
Future Opportunities
Regulation and Compliance: Laws like New York’s Local Law 88 of 2009, New York’s Local Law 97 of 2019, and California’s Title 24 contain energy or carbon requirements that will result in lower energy consumption in future tenant spaces.
Best Practices in Design: Working with architects and engineers, we have identified several ECMs and will either require or recommend their inclusion in future design.
*Any information relating to goals and progress against goals was not subject to Deloitte & Touche LLP’s review and, accordingly, Deloitte & Touche LLP does not express a conclusion, opinion, or any form of assurance on such information.
ENVIRONMENTAL Goals and Progress*
ENERGY MANAGEMENT**
Our progress in 2021 was distorted for another year, due to continued low occupancy, business closures, and reduced hours at retail stores during the pandemic. We expect our consumption to increase in 2022 above pandemic levels before returning to a trajectory of reduction in line with energy initiatives.
Waste Management
In 2021, due to low occupancy throughout much of the year, we suspended our annual waste education town halls, opting for a more targeted tenant engagement program. This was paired with the roll-out of new organics programs in 25% of our commercial office buildings.
PROCUREMENT AND RESPONSIBLE CONTRACTING
In 2021, our procurement was impacted by the emergency purchase of personal protective equipment (PPE).
WATER MANAGEMENT**
Although our water consumption reduced in 2021, due to continued low occupancy, business closures, and reduced hours at retail stores during the pandemic, we do not consider our 10% reduction goal to be achieved. We expect our consumption to increase in 2022 above pandemic levels before returning to a trajectory of reduction from water initiatives.
Goal
50% total energy reduction below a 2009 baseline by 2030 measured in kBtu/SF
Goal
75% commercial waste diversion by 2026
Goal
Every year, purchase 75% of cleaning supplies that meet sustainability criteria. These criteria include certifications designated by UL ECOLOGO, Green Seal, and EPA’s Safer Choice Standard
Goal
10% by 2030 below 2019 base year.
Goal
55% energy reduction of landlord-controlled energy by 2030
Goal
Introduce organics recycling to 50% of portfolio by 2020
Goal
45% energy reduction of tenant-controlled energy by 2030
Goal
Complete in-person Demonstration and Education on Recycling Procedures for 50% of total Vornado portfolio each year
GREEN BUILDING CERTIFICATIONS
Goal
†
LEED Certify 100% of all in-service office properties by 2024.
We paused LEED certification efforts until our tenants return to work post-pandemic.
*Any information relating to forward-looking statements, targets, goals, and progress against goals was not subject to Deloitte & Touche LLP’s review and, accordingly, Deloitte & Touche LLP does not express a conclusion or any form of assurance on such information.
†Due to the continued pandemic in 2021, we were unable to obtain meaningful data on certain metrics and tenant feedback programs. As a result, 2019 performance information has been provided rather than suspension of reporting.
Environmental Results 2021
ENERGY EFFICIENCY INVESTMENT
$23
million
spent on Tenant Energy Efficiency Capital Projects since 2012
16.5
million sf
of our New York portfolio has undergone energy efficiency capital work
$5.4
million +
saved in utility costs in 2021 from our energy efficiency projects completed since 2012
29%
rate of return since 2012
delivered by our capital projects
CUMULATIVE SAVINGS SINCE 2012
100,351
mvh
of cumulative electric savings
142,213
mlbs
of steam savings
41,992
mt co2
cumulative GHG offset
48,376
THERMS
of natural gas savings


VORNADO OWNS AND MANAGES**
27+
MILLION SF
of LEED-certified
properties
23+
MILLION SF
at LEED Gold or higher
34+
MILLION SF
of space with
ENERGY STAR rating
†For reporting boundaries, see note on p. 43
*GHG Emission Intensity includes location-based emissions from Scopes 1, 2 & 3.
**Includes commercial, retail, and residential assets

2021: 9,062 TONS
RECYCLED:
3,811 TONS
2020: 8,594 TONS
RECYCLED:
3,751 TONS
2019: 24,878 TONS
RECYCLED:
12,392 TONS

ENERGY RECOVERY:
4,386 TONS
ENERGY RECOVERY:
3,043 TONS
ENERGY RECOVERY:
7,257 TONS

COMPOSTING:
765 TONS
COMPOSTING:
1,031 TONS
COMPOSTING:
2,889 TONS

LANDFILL:
100 TONS
LANDFILL:
769 TONS
LANDFILL:
2,340 TONS
†For reporting boundaries, see note on p. 43.
An additional 38 tons
of hazardous waste were also recycled in 2021.
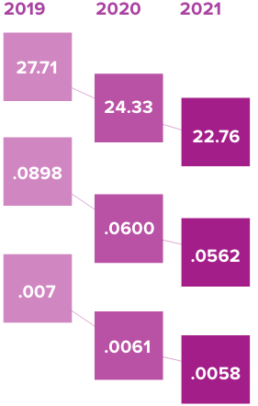
GHG EMISSIONS
The consumption and emissions data on this page are presented on an absolute basis.
In 2021, our location-based Scope 2 emissions differentiated significantly from our market-based Scope 2 emissions due to our investment in renewable energy certificates in 2021. Going forward we will continue to report our Scope 2 emissions on both a location and market basis.
Because the market-based approach reflects progress on our Vision 2030 carbon neutrality commitment, we will rely on the market-based approach for reporting on our emissions-related goals and targets, including those tied to green debt instruments and executive compensation.
Our location-based Scope 2 emissions inventory includes emissions from tenant electricity that is submetered downstream from our building electricity accounts. We consider these emissions to be within our financial control. If the emissions from submetered tenant electricity were instead to be considered Scope 3 emissions (an approach that is followed by other real estate companies), we estimate our Scope 2 emissions for 2021 to be 85,926 MTCO2e and our Scope 1 + 2 emissions intensity to be 0.0033 MTCO2e/SF.
FINANCIAL Control Method1
GHG Emissions MTCO2e
LOCATION-BASED
LOCATION-BASED
MARKET-BASED
2019
2020
2021
% CHANGE2020-2021
2021
% CHANGE2020-2021
SCOPE 1
28,577
29,190
29,864
2.3%
29,864
2.3%
SCOPE 2
177,977
133,997
131,405
-1.9%
83,295
-37.8%
SCOPE 1+2 TOTAL
206,554
163,187
161,269
-1.2%
113,159
-30.7%
SCOPE 3
49,760
42,997
39,633
-7.8%
39,633
-7.8%
GRAND TOTAL
256,314
206,184
200,902
-2.6%
152,792
-25.9%
1 We have chosen to report our emissions according to the financial control method, as discussed in the World Resource Institute’s Greenhouse Gas Protocol: A Corporate Accounting and Reporting Standard: Revised Edition. Location-Based reflects emissions for our properties based on the grid average emission factor, while Market-Based reflects emissions that we are responsible for due to our purchasing decisions. Our Scope 1 emissions include onsite combustion from oil and natural gas; Scope 2 emissions include our district steam consumption and electricity consumption, including electricity consumed by our submetered tenants; Scope 3 emissions include other utility consumption within the direct control of our tenants.
2019
2020
2021
DISTRICT chilled water
12,702
9,220
11,540

DISTRICT STEAM
259,472
186,163
178,230
ELECTRICITY
556,572
440,095
416,020
FUELS
182,586
186,127
187,256
1,011,332
821,605
793,046
COGENERATED FUELS
38,894
55,391
54,337
*Any information relating to forward-looking statements, targets, goals, and progress against goals was not subject to Deloitte & Touche LLP’s review and, accordingly, Deloitte & Touche LLP does not express a conclusion or any form of assurance on such information.
Environmental Results by Region
TRANSPORTATION SURVEY RESULTS (MILEAGE) †
As surveyed from our tenants in 2019
 Walk / Bike / Telecommute
 Bus
Bus Light Rail
 Heavy Rail
 Carpool / Alternative Fuel
 Ferry
Ferry Car: Solo
WASTE BY REGION (TONS)
GRID ELECTRICITY MIX
Source: NYCA Energy Production 2021, NYISO
 Hydro (22%)
 Wind (3%)
 Other Renewable (2%)
 Nuclear (29%)
 Gas (8%)
 Dual Fuel (35%)
LEED CERTIFICATIONS
21.7
MILLION SF
82% of total region (including retail);
30 buildings
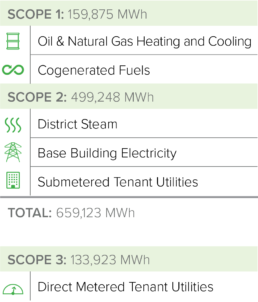
2021 GHG EMISSIONS (MT C02E)
Scope 1
24,051
Scope 2
104,547
Scope 3
32,035
Total
160,633
Scope 1: Oil & Natural Gas Heating and Cooling, Cogeneration
Scope 2: District Steam, Base Building Electricity, Submetered Tenant Utilities
Scope 3: Direct Metered Tenant Utilities
TRANSPORTATION SURVEY RESULTS (MILEAGE) †
As surveyed from our tenants in 2019
- Walk / Bike / Telecommute
- Bus
- Light Rail
- Heavy Rail
- Carpool / Alternative Fuel
- Ferry
- Car: Solo
WASTE BY REGION (TONS)
GRID ELECTRICITY MIX
Source: Com Edison Environmental Disclosure
Statement, 12 months ending September 30, 2021
- Hydro (1%)
- Wind (3%)
- Solar (1%)
- Nuclear (34%)
- Natural Gas (37%)
- Coal (23%)
 Other (1%)
LEED CERTIFICATIONS
3.7
MILLION SF
Over 99% of total region, 1 building
2021 GHG EMISSIONS (MT C02E)
Scope 1
3,944
Scope 2
14,647
Scope 3
83
Total
18,674
Scope 1: Oil & Natural Gas Heating and Cooling, Cogeneration
Scope 2: District Steam, Base Building Electricity, Submetered Tenant Utilities
Scope 3: Direct Metered Tenant Utilities
TRANSPORTATION SURVEY RESULTS (MILEAGE) †
As surveyed from our tenants in 2019
- Walk / Bike / Telecommute
- Bus
- Light Rail
- Heavy Rail
- Carpool / Alternative Fuel
- Ferry
- Car: Solo
WASTE BY REGION (TONS)
GRID ELECTRICITY MIX
Source: PG&E, 2020 Power Mix
- Large Hydro (10%)
- Renewable (31%)
- Nuclear (43%)
- Natural Gas (16%)
LEED CERTIFICATIONS
1.8
MILLION SF
100% of total region; 3 buildings
2021 GHG EMISSIONS (MT C02E)
Scope 1
49
Scope 2
9,131
Scope 3
-
Total
9,180
Scope 1: Oil & Natural Gas Heating and Cooling, Cogeneration
Scope 2: District Steam, Base Building Electricity, Submetered Tenant Utilities
Scope 3: Direct Metered Tenant Utilities
†Due to continued low occupancy during 2021, survey results reflect 2019, the last full normal year of operations.